Water Quality Map Overview
The Protecting Florida Together water quality map delivers statewide water quality information, including blue-green algae, red tide and nutrients. The map also highlights applicable restoration projects.
The map is designed to ensure transparency and accountability with respect to water quality data and its availability to the public. Information on this map is provided by the Florida Department of Environmental Protection, Florida Fish and Wildlife Conservation Commission and Florida Department of Health.
Protecting Florida Together invites you to explore the areas of Florida that are important to you. Individual waterbodies within a watershed are highlighted based on the assessment status of the important nutrient parameters for that waterbody. Rivers, lakes and streams show the current assessment statuses of applicable parameters such as total phosphorus, chlorophyll-a, and either total nitrogen or nitrate-nitrite depending on which nitrogen parameter is the key nutrient for the waterbody. Springs show the current assessment status for nitrate-nitrite.
Markers on the map indicate where a sample was taken to determine the presence of harmful algae or algal toxins. Categorical data are described below in greater detail. After clicking on a marker, data for that location will be displayed and an explanation of the information will be provided. The conditions presented on this map are representative of the time and location that the sample was collected.
Actual environmental conditions can change quickly, and algal blooms may appear suddenly. Please always be aware of your surroundings and report any observed blooms at FloridaDEP.gov/AlgalBloom.
In addition to water quality data, Protecting Florida Together provides you the ability to view restoration projects by selecting a basin management action plan area. Locational markers are provided, where available, and can be filtered based on project completion status. However, not all projects have locational data. To view all basin management action plan restoration projects, select "View All Projects."
Health notifications displayed on the water quality map are intended to communicate known or possible health impacts based on prevailing water quality conditions. Specific health notifications are described in greater detail when you click on a marker.
Health notifications related to red tide and blue-green algae appear solely based on their presence at time of sampling. Relevant language is provided that describes the precautions individuals should take in these areas.
Two tiers of health notification are provided, caution and alert. A caution is issued when observations indicate that environmental or health effects are possible. A caution is provided for blue-green algae when either a bloom is observed during sample collection or when sampling results show the dominant species to be cyanobacteria. A caution is provided for red tide when Karenia brevis is detected at low concentrations, between 10,000-100,000 cells per liter.
Alerts represent a higher associated health risk than caution. An alert is provided for blue-green algae when cyanotoxins such as microcystin are detected in the water and care should be given to avoid contact. An alert is provided for red tide when Karenia brevis is detected at concentrations above 100,000 cells per liter, when environmental or health effects are likely.
Those interested in receiving email notifications for their area, may register by visiting the preference center.
Report
- Online 24/7: ReportAlgalBloom.com
- Toll-free hotline Mon-Fri 8 a.m.-5 p.m.: 855-305-3903
Information On Blue-Green Algal Blooms
Report
- Observe a stranded wildlife or fish kill
- Fish Kill and Disease Report Form
- 800-636-0511 (Fish Kills)
- 888-404-3922 (Wildlife Alert)
Information on Red Tide or Other Saltwater Blooms:
Report Human Illness
- Florida Poison Control Centers can be reached 24/7 at 800-222-1222
Contact DOH County Office for Other Public Health Concerns
DEP, FWC and other local and regional entities regularly monitor Florida’s water quality, and routinely collect algal bloom samples for analysis. Blue-green algae markers on the map are displayed when a sample is taken for blue-green algae. Data is submitted daily by field staff.
Field staff note whether bloom conditions, such as a scum layer or flecks, are present when the sample is taken. If bloom conditions are observed by DEP field staff, the marker will have a blue-green dot. If the toxins commonly associated with blue-green algae, such as Microcystin, are detected at any concentration, this will be indicated by a red dot with an exclamation point added to the map marker. If toxins are not detected and no bloom is observed, then the dot on the marker will show as grey.
Please be aware, there is a time delay from the time a sample is taken to the time the analysis is completed at the lab to identify the presence of toxins, and therefore displayed on the map. Always be mindful that blue-green algae can appear or disappear more quickly than reports may be received or updated.
Although blue-green algae occur naturally in Florida’s waterbodies, increases in the delivery of nutrients to any particular waterbody can promote algal growth that ultimately leads to the formation of an algal bloom.
Other factors that often contribute to algal blooms include warm water temperatures and changes in water flow. Although they can occur at any time, blue-green algae blooms are most common in Florida during the summer and early fall when sunlight is abundant and water temperatures are highest. The summer also brings storms that have the potential to affect the delivery of nutrients into waterways through stormwater runoff.
Families can use the water quality map before visiting featured waterbodies.
Gold red tide markers are displayed on the map when the algae that causes red tide, Karenia brevis, has been detected above background concentrations. Data is received from FWC daily.
Each gold marker will include a colored dot (gray, white, yellow, orange or red) indicating the concentration level of red tide present at that location. If red tide is not reported again after eight days at that location, the marker will be removed from the map.
Florida’s efforts and research on harmful algal blooms have been sustained at a high level for many years. Red tide occurs naturally almost every year. Since the severe blooms in 2018, the state and its partners have placed a renewed effort on collaboration and communication of harmful algal bloom information to the public.
The water quality status tab shows whether a waterbody is meeting water quality thresholds or criteria for applicable water quality parameters including total phosphorus, chlorophyll-a, total nitrogen and/or nitrate-nitrite. Waterbodies are not always assessed for all parameters—waterbody type (e.g., spring, stream, lake, etc.) and region impact what parameters are assessed. For example, nitrate-nitrite is the key water quality parameter tracked in springs, and thus the only one displayed. The majority of streams are assessed for total phosphorus, chlorophyll-a, and total nitrogen, but in some waterbodies, there are site-specific nutrient criteria. The displayed water quality status is based on DEP’s watershed assessment, in accordance with the Impaired Waters Rule.
Waterbodies within a watershed not attaining one or more of the thresholds or criteria will display in purple. Waterbodies within a watershed attaining thresholds or criteria for all the parameters will display in blue. In waterbodies where at least one component is not assessed due to insufficient data but other components are meeting water quality thresholds or criteria, the waterbody will display in blue and gray stripes. In waterbodies that display in gray, “Insufficient Data for Assessment” means that 1) for streams – there are some data available to calculate annual geometric means (AGMs), but additional supporting information (such as bioassessments) are not available to fully determine the water quality status for the applicable water quality standards; 2) for all waterbody types – there are some data available to calculate AGMs, but an insufficient number of consecutive years of data to determine the water quality status; or 3) there is no data available for the parameter.
“View Waterbody Details” provides information on the waterbody assessed and shows the assessment status individually for total nitrogen, nitrate-nitrite, total phosphorus and chlorophyll-a, as applicable.
When sufficient data are available, “View Waterbody Trends” will show a graph of AGM concentrations for each of the applicable parameters over the last 15 years. The AGMs included in the most recent waterbody assessment are highlighted as blue or purple depending on the outcome of the assessment as attaining water quality thresholds/criteria or not, respectively. If there is insufficient data for assessment or the parameter has not been assessed, the AGMs are highlighted as gray. AGMs highlighted in black are either older or newer than the last complete assessment. The parameter of interest is selected above the graph title. A second graph shows all monitoring data for the selected analyte for the last 15 years from representative stations used for the waterbody assessment. “Get More Data” allows users to search for additional monitoring data from the Watershed Information Network.
If present on the graph, the horizontal line represents a threshold value for the waterbody and is used to provide context to the data presented for the general public. These thresholds do not represent a determinative value relating to the water quality status for each waterbody. AGM results above this threshold indicate that water quality concerns are more likely. Results below this threshold indicate that concerns are less likely. The threshold values are only applicable to AGMs. They do not have meaning relative to the individual sample results.
Threshold values are not provided for every waterbody, because for some waterbody types, it is more appropriate to examine a different water quality parameter or different calculation approach.
- For example, spring vents have no thresholds for total nitrogen, total phosphorus, or chlorophyll-a, because the standard for springs is nitrate-nitrite.
- For some other waters, the applicable criteria are based on nutrient loading (e.g., kilograms per year) instead of a concentration (e.g., milligrams per liter) or the criterion expression is not an annual geometric mean.
- For some estuaries, multiple criteria apply because the waterbody comprises more than one estuary nutrient region. For these waters, the threshold value is the average of the individual estuary nutrient regions.
- Some waterbodies have site-specific, loading-based criteria (e.g., pounds per year) that were set when the department adopted a Total Maximum Daily Load for the water. These waterbodies will continue to be identified as meeting or not meeting their criteria until the department can confirm the nutrient loading criteria have been achieved, irrespective of the nutrient concentration results of routine monitoring.
Additional detail on the data and methodology for blue-green algae, red tide, nutrients and chlorophyll, and restoration projects is provided below.
Blue-Green Algae
Markers for blue-green algae appear within 24 hours of sample collection. After 10 days, the marker will be removed from the map. If a follow-up sample is taken, the information on the sample will reflect any new information.
Algal bloom samples are inspected to identify the type of algae present. If the algae identified can produce toxins, the water is then tested to determine if toxins are present and at what concentration. Once testing is complete, information is displayed under Health Notification to indicate whether cyanobacteria was the dominant species detected and whether toxins were present at the time the sample was collected.
DEP currently monitors for cylindrospermopsin, anatoxin a, and the following nine species of microcystins: MC-LR, MC-LA, MC-LF, MC-LW, MC-LY, MC-RR, MC-WR, MC-YR and Desmethyl MC-LR. If the dominant species of cyanobacteria can produce saxitoxin, then DEP also tests for saxitoxin.
Although other variants of microcystins exist, DEP does not test for all variants due to a lack of commercially available testing materials. DEP continues to expand their monitoring program as reliable test methods become available.
Red Tide
Red tide data are provided daily from the FWC’s Fish and Wildlife Research Institute Harmful Algal Bloom Database. Data presented on Protecting Florida Together represents the most recent eight days of sampling location points for the phytoplankton that causes red tide, Karenia brevis. While every practical step has been taken to provide accurate data, the need for rapid distribution precludes extensive review.
- Please reference the FWC-FWRI HAB Monitoring Database as a primary source for all Florida related red tide data.
- If you have any questions or should you wish to share this data further, please contact HABData@myFWC.com.
Nutrients and Chlorophyll
Total nitrogen, total phosphorus and nitrate-nitrite are measured in milligrams per liter. Chlorophyll-a is measured in micrograms per liter. Total nitrogen is a calculated result that uses the "Nitrogen-Total" field from DEP’s Impaired Waters Rule database.
The Annual Geometric Means (AGMs) displayed under the waterbody trends are calculated in accordance with the Impaired Waters Rule. The minimum number of sampling results to calculate an AGM at each station is four (by parameter), with at least one sample taken between May 1 and Sept. 30 and at least one during the other calendar months. Station-parameter combinations that do not meet the minimum requirements are indicated by the label "Insufficient Data for Assessment" and, in such a case, means insufficient data to calculate an AGM. Not all the collected data are useable in AGM calculations; "qualified" data are reported results that come with cautions about how they should be used and interpreted.
The following table defines common qualifier codes that may be associated with data:
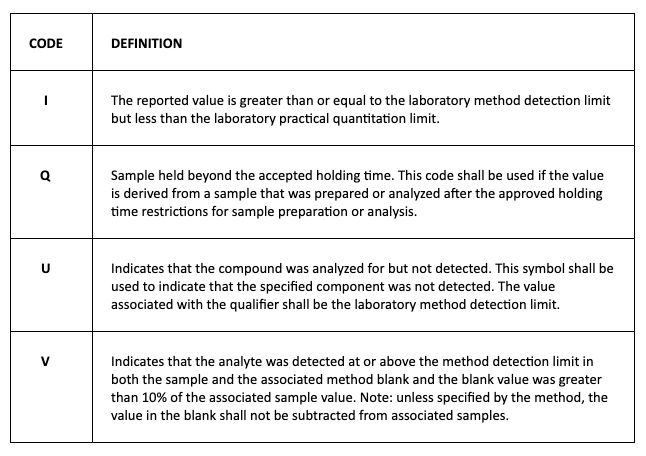
Data that are reported with the above qualifier codes are used in the following way when calculating annual geometric means:
- Samples with V or Q qualifier codes are omitted from calculations.
- Samples with I qualifier codes are set to the method detection level of the analysis.
- Samples with U qualifier codes are set to half the method detection limit or half the criterion, whichever is lower.
Restoration Projects
The map displays restoration projects tracked by DEP as part of adopted basin management action plans (BMAPs) or alternative water supply plans, and other projects funded through water management district budgets and various grants for projects providing water restoration benefits. Projects have been related so that only one marker is shown on the map when a project contains multiple phases or is tracked for multiple purposes.
The projects displayed on the map fall in one of these statuses:
- Completed – Project/activity that is finished.
- Ongoing – Project/activity that has commenced or initiated but has no planned end date. Examples include street sweeping and public education.
- Underway – Project/activity that has commenced or initiated but is not yet completed. This can include projects in the design or permitting phases.
- Planned – Project/activity that is conceptual or proposed.
Project funding is tracked by DEP for multiple purposes. Projects identified as having “DEP-administered funding” have funds administered by DEP staff under various grant programs. All other projects with no DEP-administered funds are identified as using “Other Funding.”
Where project location information is available, projects have been associated with relevant boundaries of interest based solely on whether the reported project location is within a boundary. In some cases, project locations were not available. Square markers indicate where default locations have been assigned based on other known project factors. As locations are provided for these projects, the markers will be updated on the map.
"No data" appears within the project information when data is not available for that attribute. Some attributes do not apply to certain projects and some data have not yet been provided to DEP.